

Embracing visual innovation

Posted by: Theo Paraskevopoulos
01 April 2021
Investors receive large amounts of data via multiple digital touchpoints. Advanced Data Visualisation helps asset and wealth managers communicate data effectively
Today wealth and asset managers are able to send their clients large amounts of investment data via multiple digital touchpoints. This has created a need to make that data as organised and simple as possible.
Investors value relevant and uncomplicated reporting that helps them to make quick, informed decisions on their financials. The old way of looking at financial data - as pages filled with columns of stats and percentages - is long gone, because it’s a challenge for the human eye and brain to transform such data into meaningful insights. That challenge is what is driving the ongoing evolution of data visualisation.
Financial data has changed from being a drudge to a discovery
What is data visualisation?
Data visualisation is the graphic representation of data - think of a pie chart or bar graph, both of which have been around since the 1800s. The human eye is naturally drawn to colours and patterns, because it’s the way we first learn to process incoming information in our formative years. In the last few decades, human society has become increasingly visual - people now prefer to view or watch rather then read, and the average attention span has shrunk. For all of these reasons, it makes sense for data to be rendered as visually as possible - and new technology is revolutionising data visualisation far beyond basic 2D pyramids and charts.
Towards a more engaging data experience
In the data-saturated financial environment of the 2020’s, intuitive automation can now transform data into a host of eye-catching forms - bubble clusters, 3D pyramids, gauges, meters and more. This is the realm of Advanced Data Visualisation (ADV). The visual variety it affords fascinates the human brain, especially when it becomes an interactive digital experience in which you can peel away layers, remove or add information and watch data ripple and change in 3D. In short, it transforms financial data from being a drudge to a discovery.
The easiest way for your brain to interpret large amounts of information
ADV’s core value is that it enriches the trust relationships between wealth managers and their clients, by enabling clients to quickly spot patterns and trends in their data, draw useful conclusions more quickly and feel comfortable that their investment information is fully transparent (an important motivator in the post-recession era).
Start with the end-user
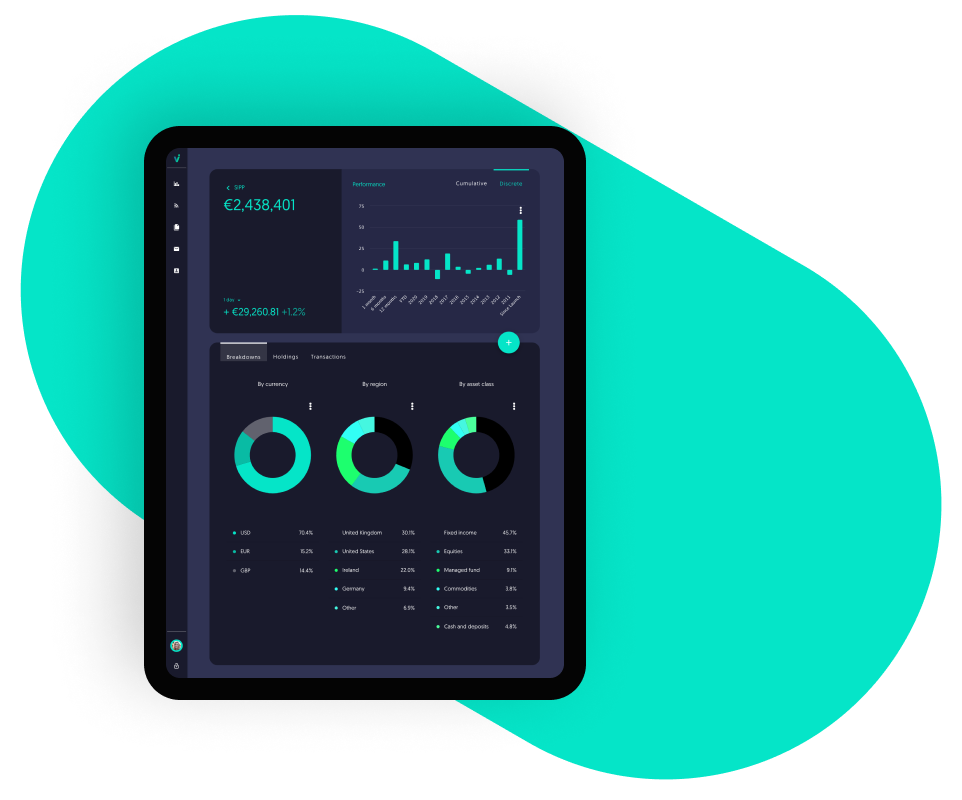
At Invessed, we tailor the digital experience exclusively for wealth and asset managers and investment brands who want to delight their clients. Our mobile-friendly solution houses all information and analytics in one digital hub with secure, clear reporting. Because we built our platform with user experience as the priority, it incorporates ADV capabilities to render financial data in a variety of compelling visual forms.
Intuitive automation can now transform data into a host of eye-catching forms
As the way financial data is shared keeps evolving in the coming years, our technology will keep pace and incorporate the latest innovations. Machine learning and A.I. will likely play an increasing role in helping investors to parse and contextualise incoming data, while the human designers of platforms like ours will bring intriguing new creative ideas to the way that data is presented.
If you’re ready to turn your clients’ data into moving art, request a demo today.